Cities, SI Urban 2/2022
The Carbon Footprint on the Cable Car
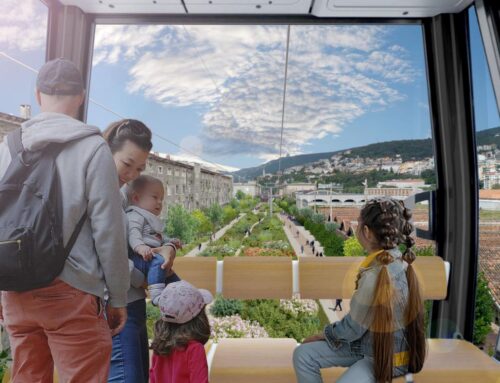
Jörg Niemann presented a study about La Paz, in which the most sustainable transport solution was sought – in consideration of the life cycle of various modes of transport. The urban cable car performed best.
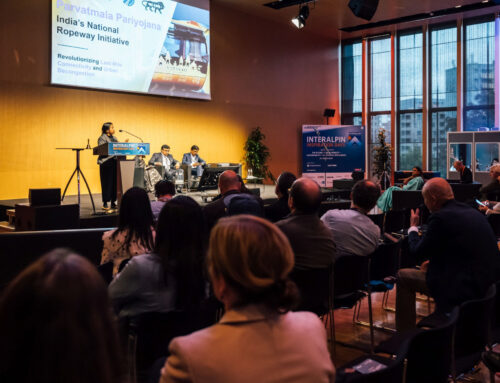
“Not every environmentally conscious idea is also sustainable. For example, the German city of Düsseldorf introduced an environmental lane and thereby simply moved the problem: the traffic jam became longer.” This was the example use by Jörg Niemann, Professor of Industrial Engineering, to begin his presentation at Cable Car World.

Prof. Dr. Jörg Niemann
Prof. Dr. Jörg Niemann
Professor of Industrial Engineering – Düsseldorf University of Applied Sciences
Professor of Industrial Engineering – Düsseldorf University of Applied Sciences
Since 2012 Jörg Niemann has been a professor at Düsseldorf University of Applied Sciences in the education and research area of industrial engineering, with a focus on production in the department of mechanical engineering and process technology. Moreover, he acts as an executive board member of interdisciplinary research institute FMDauto and as founder of the FLiX research centre for life cycle excellence. Focuses of his work lie in the areas of life cycle & services management as well as evaluation and optimisation of production systems by means of lean management methods.
Sustainable mobility is not as easy as some might think. Aspects such as land sealing, traffic flow, heat management, green spaces and residential environment must be considered.
“We have to address the complex interaction and prioritisation of the different needs of numerous stakeholders,” Niemann emphasised.
Measuring sustainability
In view of the complexity of urban mobility, the question therefore arises: how can the “sustainability” of different urban transport systems be measured and evaluated?
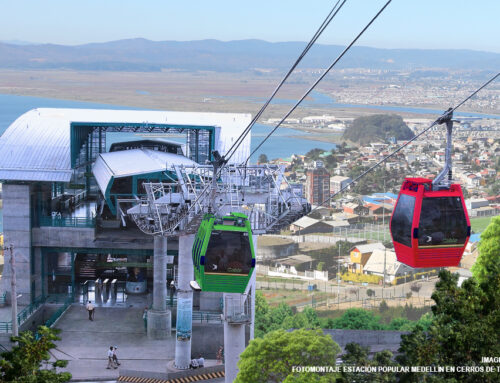
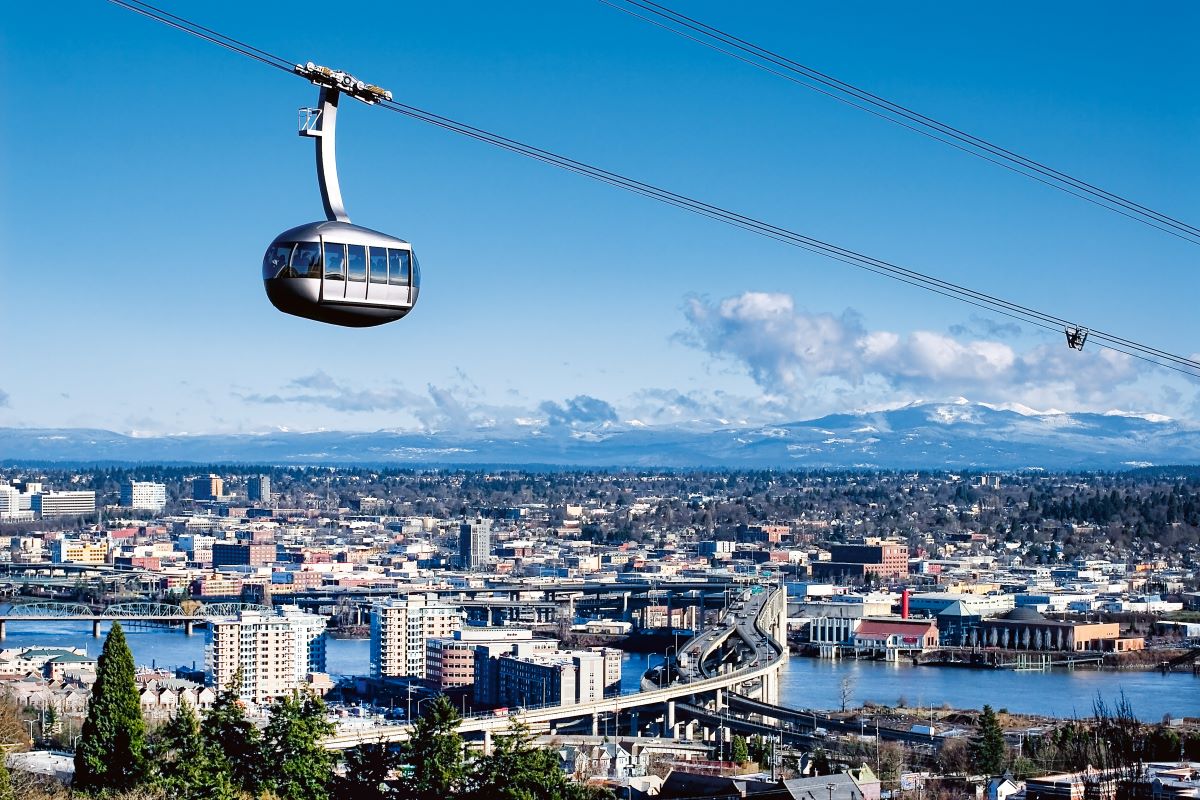
To this end, Niemann presented a study of alternative urban transport systems in La Paz, Bolivia. The search was for the most sustainable transport solution.
The task was to connect the stations 16 de Julio (El Alto) to Estación Central (La Paz) with the local public transport network.
What was required was a transport capacity of 2,000 people per hour in both directions. “Operating hours were assumed to be an average of 16.57 hours per day, 365 days per year, over a lifetime of 30 years,” Niemann said.
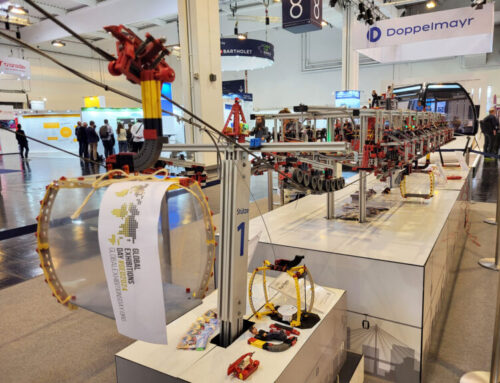
The life cycle
of a mode of transport: material – product – distribution – operation – end of life. Image: DOPPELMAYR

Under consideration were large buses, small buses, tram and cable car. The fastest route by road is 12.4 kilometres long and takes 18 minutes; the shortest route by road is 5.8 kilometres long and takes 20 minutes.
“By contrast, the cable car calls for a route that is only 2.3 kilometres long and a travel time of only ten minutes,” Niemann reported.
Life cycle as a frame of reference
However, sustainability means more than short and fast routes. In order to be able to compare the modes of transport accordingly, a standardised life cycle assessment is required.
“Here, we define system limits, system performance and evaluation methodology on the basis of carbon footprint. Moreover we obtain data on the input and output flows of each mode of transport,” Niemann explained.
To be precise, the entire life cycle of the mode of transport is taken into account: from material phase through production of the infrastructure and vehicles, as well as delivery and construction of the system, to use and maintenance of the vehicles.
Moreover the end-of-life phase is also taken into account, i.e. dismantling, recycling and disposal.
The difference
between the smallest and largest carbon footprint of the modes of transport under consideration amounts to factor 5.

Unbeatable carbon footprint
The results of the sustainability study using the example of La Paz can be summarised in three points. First: the design, system structure and maintenance of a mode of transport contribute significantly to the emissions over the life of the system.
Second: the absolute emissions from system provision and maintenance of a tram are greater than the total emissions of a cable car over the life cycle.
Third: the difference between the smallest and largest carbon footprint of the modes of transport under consideration amounts to approximately factor 5 – the small bus performs worst, followed by the large bus and the tram.
“At the top is the cable car, which has an unbeatable carbon footprint,” Niemann highlighted.
Relative and total emissions
In this context it is important to consider the total emissions of a mode of transport and not only the relative emissions, for example on the basis of kilometres of passenger capacity.
“This value is misleading. Before you have built a tram, your cable car has already run for 30 years and been dismantled,” Niemann said.
Sustainability must be considered holistically; ecological, economic and social criteria need to be aligned.
Summary
The cable car displays a significantly smaller carbon footprint in comparison with the alternative transport systems for the defined scenario.
“The cable car is therefore a very low-emission option for transport systems in urban spheres,” Niemann summarised.
For comparison of the modes of transport it is important to define the “functional unit” as the basic scenario and the calculation framework from the perspective of the life cycle.
In addition, the transport units and calculation system must be defined in advance, as sustainability has many aspects, which must be comprehensively considered and aligned.